Three Charts of Figure skating women world records
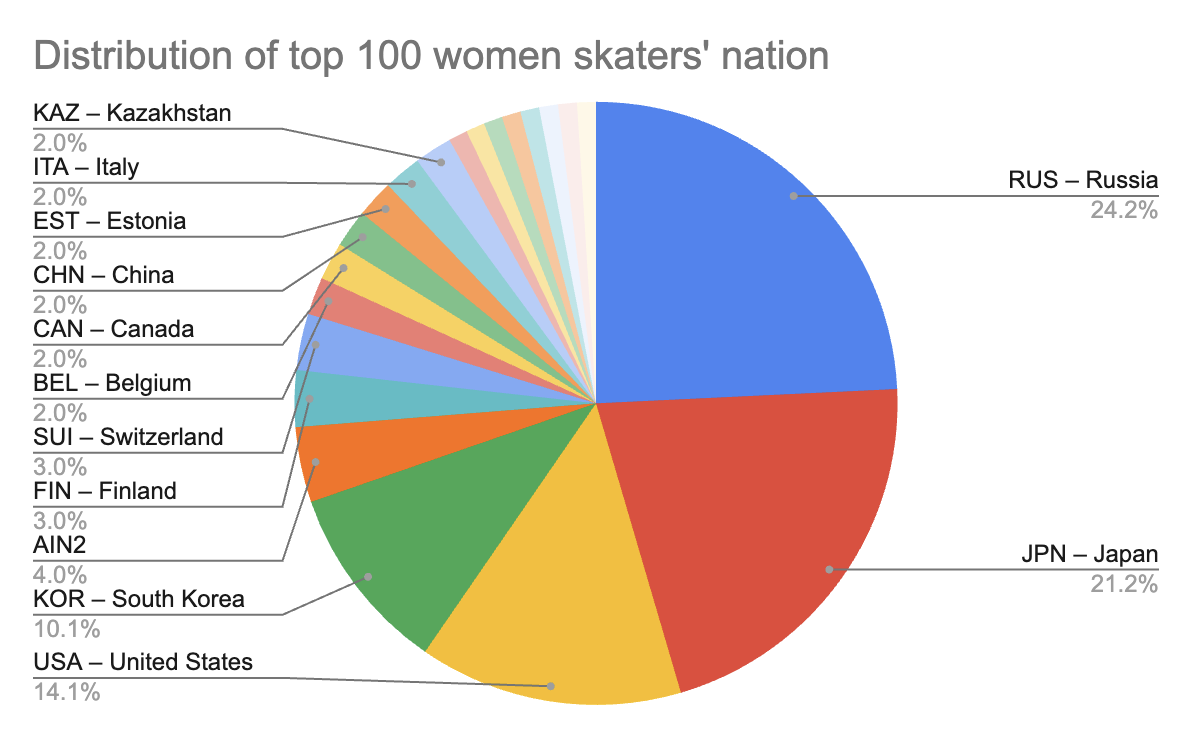 Chart 1: The distribution of skater by nationalities in the top 100 world records.
Analysis: The pie chart clearly shows that Russia has the most skaters in the top 100 world wide, then followed by Japan and US. However, it can not show the trends with across the time period. For example, the number of russia skaters increased significantly around the year of 2022.
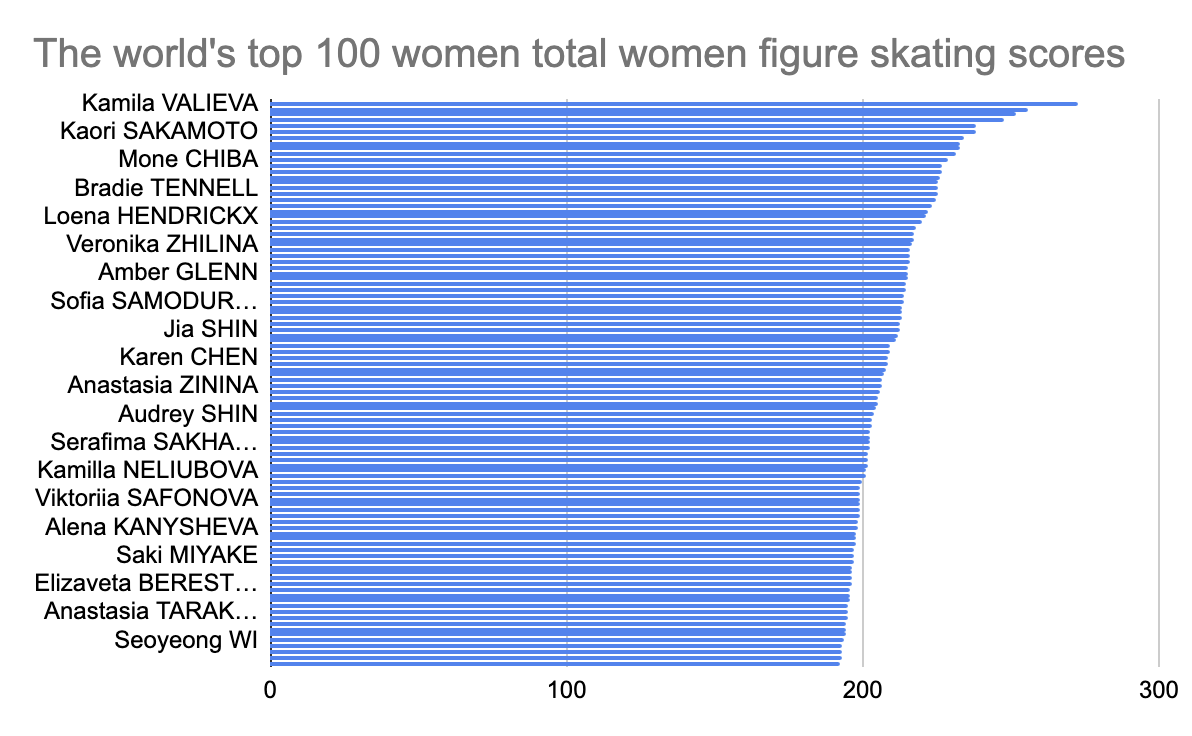 Chart 2: The world's top 100 women total women figure skating scores
Analysis: The bar chart simply demonstrated the range of the top 100 scores, with a clear difference between the rankings. However, 100 skaters is too many for the y-axis, therefore this chart is not able to compare specific skaters. This can be improved if the chart is interactive, which the visitor can choose the skaters that they want on the chart.
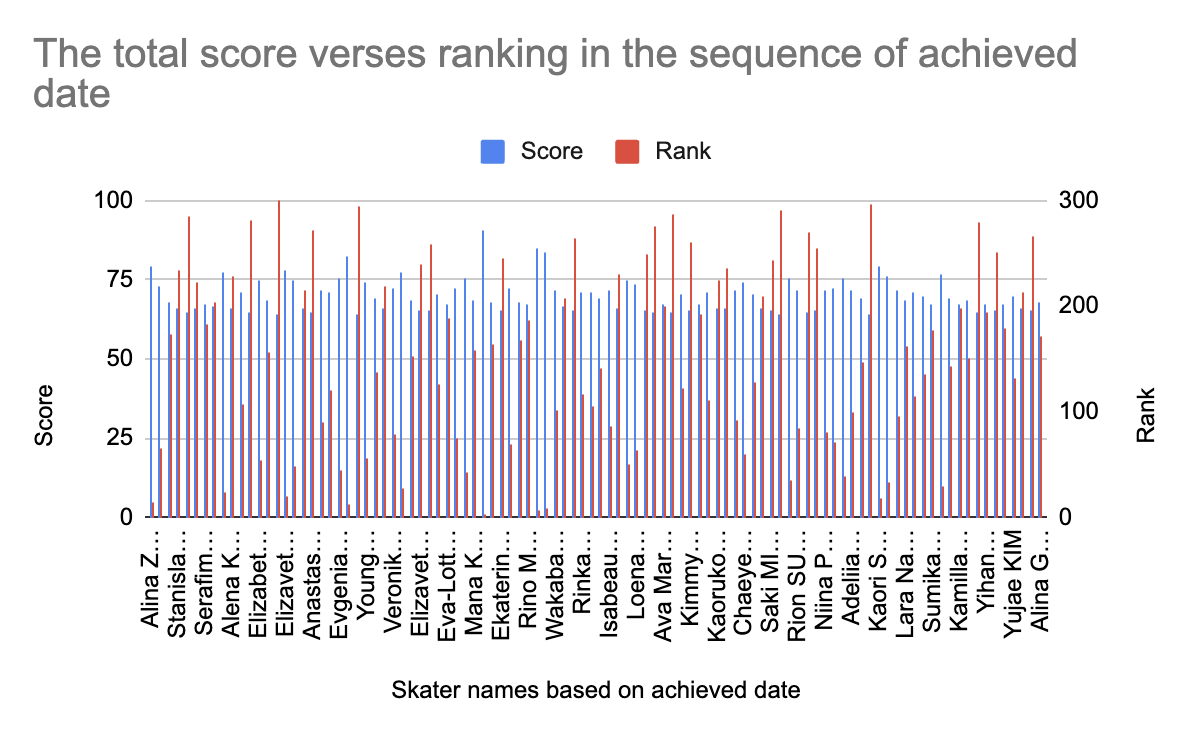 Chart 3: The total score verses ranking in the sequence of achieved date
Analysis: This bar chart is more complicated comparing to chart 2, since it has two y-axis. It shows the world top scores over time. However, if there are specific year labels it could be better. The same problem with chart 2, 100 skaters is too many to display on the x-axis. If it is interactive, the visitors may able to see at what time people break the world records with what difference.